In the high-stakes world of Formula 1 economics, the timesheet is often a vanity metric, while lap count and energy deployment efficiency serve as the true indicators of asset health. The Sakhir Mirage has presented us with a set of F1 2026 testing results that require a forensic audit, not a superficial glance. While Mercedes tops the valuation charts with a blistering 1:17.362, the underlying fundamentals suggest that the market leaders—specifically Red Bull Ford—are engaging in sophisticated energy hedging that the current data fails to capture.
The Valuation of Speed vs. Operational Robustness
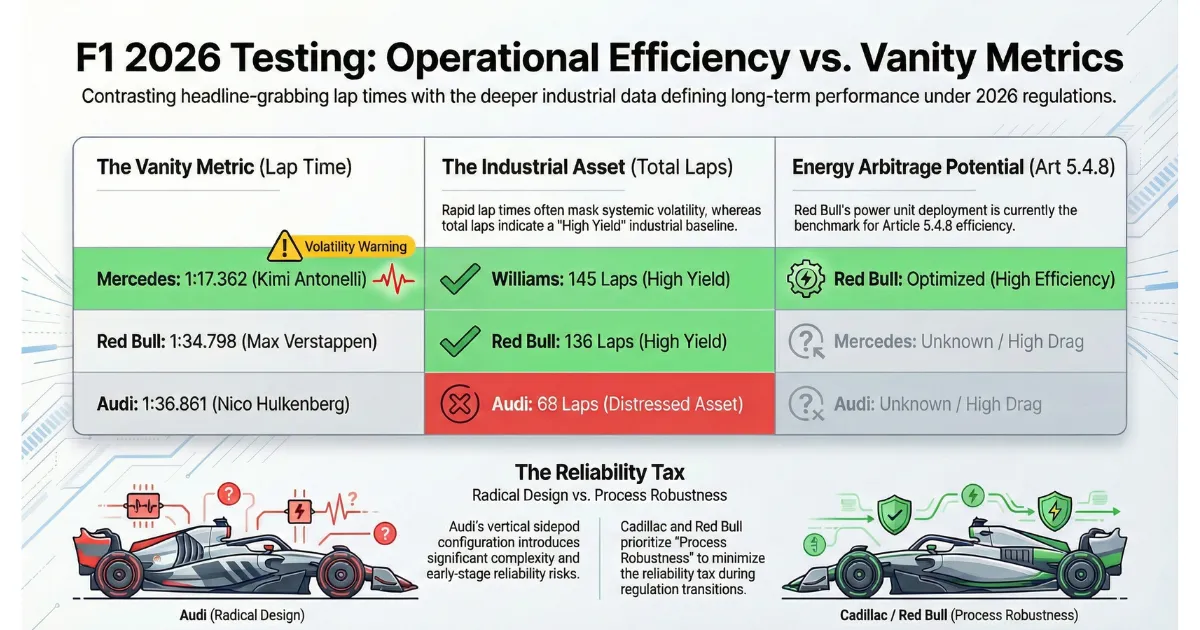
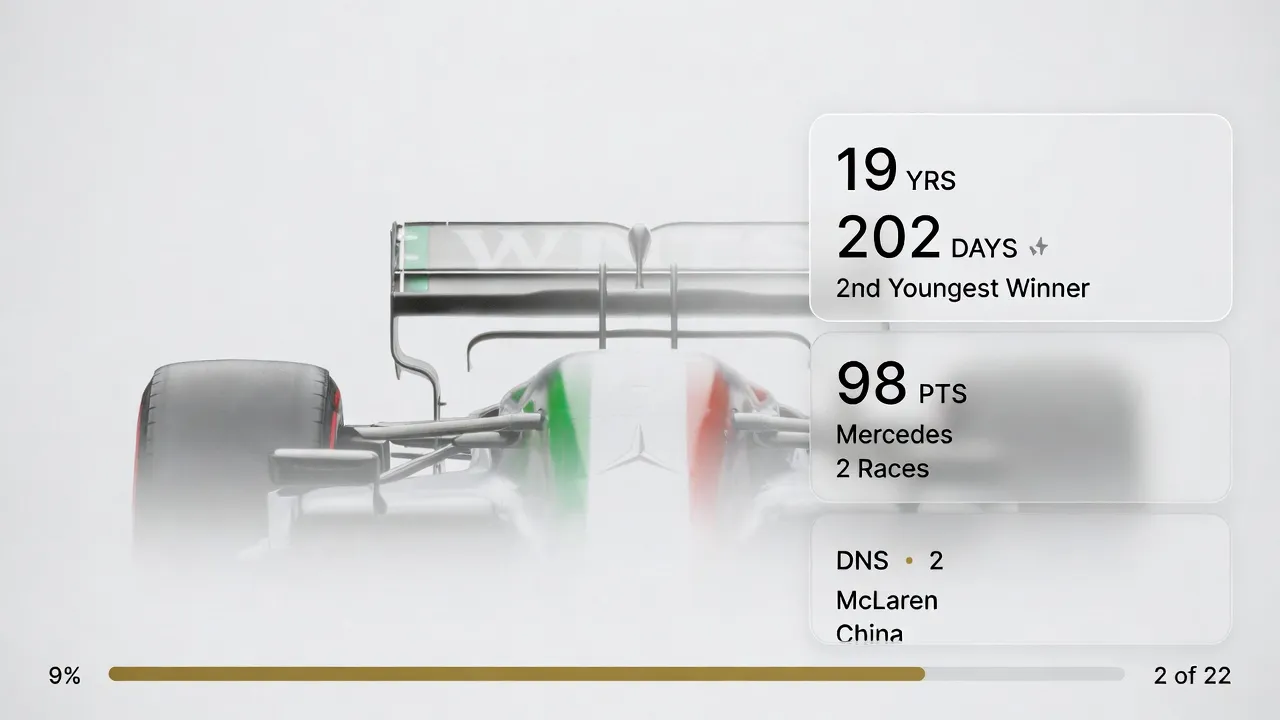
The headline figures from Bahrain present a distorted picture of the market reality. Mercedes, led by Kimi Antonelli, appears to have secured a quick ROI on their winter development. However, experienced analysts of the Economy of Things know that winter champions often face a bearish correction by the time the European leg begins. The disparity between Mercedes' single-lap pace and their reported "visible niggles" (brake locking, traction inconsistency) suggests a volatile asset—high peak performance with significant operational risk.
Contrast this with Red Bull Ford. Their 136-lap marathon on Day 1 is not just a sporting achievement; it is a declaration of industrial efficiency. In an era where power units are capped by complex deployment curves, reliability is the ultimate hedge against regulatory volatility. Max Verstappen’s mileage confirms that Milton Keynes has successfully integrated the new 185kg power unit (Article 5.7.2) into a cohesive package, minimizing the "reliability tax" that is currently bankrupting Audi's track time.
Regulatory Arbitrage: Article 5.4.8
The most significant takeaway from the F1 2026 testing results is the invisible war over Article 5.4.8. This regulation, which defines the electrical deployment decay P(kW) = 1800 – 5 * car speed, essentially creates a managed market for power.
Toto Wolff’s admission that Red Bull is the "benchmark" for deployment suggests that the reigning champions have found a form of regulatory arbitrage. By optimizing their energy flow within the 3000MJ/h constraints (Article 5.4.3), Red Bull is likely deploying capital (energy) more efficiently at critical moments than their competitors. They aren't just spending energy; they are investing it where the ROI (lap time) is highest, navigating the 350kW limit with algorithmic precision that Mercedes and Ferrari are still trying to model.
The Partial Mode Correction
The introduction of the "Partial" Aero Mode under Articles 3.10 and 3.11 represents a regulatory patch. The FIA, realizing that its zero-drag pursuit created a liquidity crisis in safety (loss of front-end authority), forced a complex mechanical solution onto the teams. This is a classic case of over-regulation leading to over-engineering. The cost of developing these active systems is a sunk capital expenditure (CapEx) that yields no performance gain—it merely allows the car to function safely. Teams that mastered this integration early (Red Bull, Cadillac) have a lower operating cost basis going into the season than those still debugging the software (Audi).
The New Entrant Dilemma: Audi vs. Cadillac
The F1 2026 testing results offer a fascinating case study in corporate strategy between two new power unit manufacturers:
- Audi (The Radical Gamble): Audi has opted for a high-risk technical strategy, mimicking the Ferrari 640’s vertical inlets. This radical differentiation has resulted in a severe reliability tax. Sitting three seconds off the pace with a car that spends more time in the garage than on the track is a classic sign of an asset distressed by technical debt. Their innovation has outpaced their operational capability.
- Cadillac (The Industrial Standard): Conversely, Cadillac has taken a robust, process-driven approach. Despite Lewis Hamilton’s skepticism regarding the barriers to entry for new manufacturers, the American outfit delivered 107 laps. This suggests that in the 2026 era, industrial process control is a more valuable currency than historical racing pedigree. Cadillac has proven that a well-managed supply chain and integration strategy can mitigate the complexity premium of the new regulations.
Conclusion: The Efficiency Metric
As we look toward Melbourne, the smart money ignores the 1:17.362 lap time. The true value in the F1 2026 testing results lies in the energy efficiency derivatives. In a capped economy (300kJ storage limit per Article 5.4.18), the team that wastes the least energy will yield the highest dividend. Currently, market indicators point to Red Bull dominance, masked by a conservative testing program, while others are spending their energy capital just to stay solvent.


